|
(2)Judicial Police - The Forensic laboratory The
Forensic Laboratory is a department administrated by the Judiciary Police.
Its main functions are to provide local judiciaries and law-enforcing agencies
with services concerning scientific evidence and technical support, perform
analyses and draw conclusions on results of examinations which are used by
law-enforcing agencies as grounds of convictions, thereby, providing
substantial help towards fair adjudication during criminal trials and civil
proceedings. At present, the Forensic Laboratory possesses basically the
advanced equipments and analytical expertise; in addition, it purchased
several new advanced equipments in 2002 that greatly raises efficiency and
the level of analytical expertise. The Drug and Toxicology Section of the
Forensic Laboratory has taken upon itself the analysis of all the controlled
drugs and substances that are locally seized by law-enforcing agencies and
controlled by Decree 5/91/M, including Heroin, Cannabis, Cocaine, Ice,
Ketamine, MDMA, MDA and all kinds of psychotropic substances. Since August
2002, the Forensic Laboratory has developed quantitative analysis on drugs
and has provided services of quantitative analysis of MDMA and MDA, Ice and
Ketamine in ecstasy as well as Ketamine in powder thereby playing a vital
role for law-enforcing agencies in the determination of level of penalty and
adjudication. (1) Overview
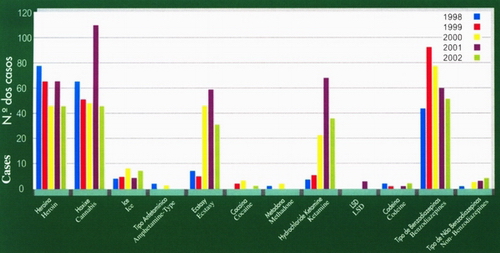
of the Condition of Controlled Drug and Substances In the
year 2002, the Forensic Laboratory analyzed a total of 295 cases, including
35 cases of quantitative analysis. Among cases of qualitative analysis, 44
were heroin-related cases with total weight accounting to 57.96g that,
compared to the year 2001, decreased by 30%, 64 cannabis-related cases with
total weight accounting to 570.96g, decreasing by about 50%. In addition,
cases of ecstasy, ketamine and Benzodiazepines submitted for analysis took a
downward trend (see Diagram 1 and Diagram 2).
|
|
|
Heroin |
Cannabis |
Ice |
Amphetamine-type |
Ecstasy |
Cocaine |
Methadone |
Ketamine |
LSD |
Codeine |
Psychotropic substances |
|
|
Benzo |
Non - Benzo |
|||||||||||
| 1998 |
77 |
64 |
6 |
2 |
12 |
- |
1 |
5 |
- |
2 |
69 |
1 |
| 1999 |
64 |
50 |
6 |
- |
7 |
3 |
- |
9 |
- |
1 |
110 |
- |
| 2000 |
44 |
47 |
16 |
1 |
63 |
4 |
2 |
42 |
- |
- |
99 |
4 |
| 2001 |
63 |
111 |
6 |
- |
77 |
- |
- |
86 |
4 |
1 |
79 |
5 |
| 2002 |
44 |
64 |
11 |
- |
51 |
1 |
- |
55 |
- |
3 |
70 |
7 |
Diagram 1: Comparison of Cases
of Controlled Drugs: Substances Submitted for Analysis
|
|
|
Heroin |
Cannabis |
Ice |
Ampheta-mine-type |
Ecstasy |
Codeine |
Cocaine |
Methadone |
Ketamine |
LSD |
Psychotropic substances |
|
|
Benzo |
Non - Benzo |
|||||||||||
|
|
(g) |
(g) |
(g) |
(g) |
(pill) |
(g) |
(pill) |
(g) |
(pill) |
(pill) |
(pill) |
(pill) |
| 1998 |
2217.04 |
2649.27 |
73.05 |
150 |
100 |
- |
45 |
5.19 |
- |
8bottles |
4842.5 |
94 |
| 1999 |
349.07 |
905.02 |
172.83 |
- |
114 |
55 |
- |
11.88 |
- |
3bottles |
6948 |
- |
| 2000 |
146.86 |
16424.83 |
271.53 |
4.65 |
3237.25 |
8.363 |
1 + |
524.01 |
- |
- |
19190 |
1425.5 |
| 2001 |
73.76 |
2185.71 |
13.96 |
- |
3808.75 |
- |
- |
1654.69 |
11 |
4 |
3112.5 |
560 |
| 2002 |
57.96 |
570.96 |
649.93 |
- |
3397.75 |
27.08 |
- |
882.75 |
- |
49+ |
3193.5 |
454 |
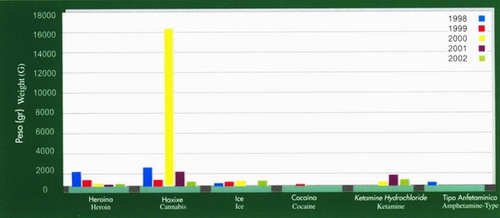
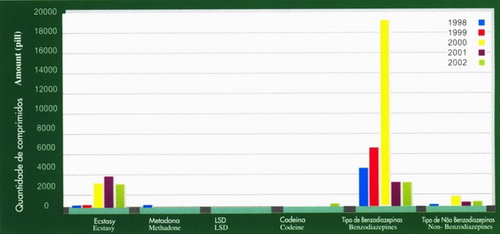
Diagram 2 :Comparison of Amounts of Controlled Drugs: Substances submitted for analysis (1998-2002)
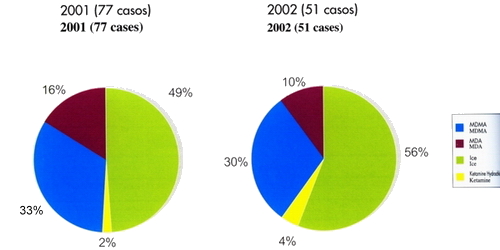
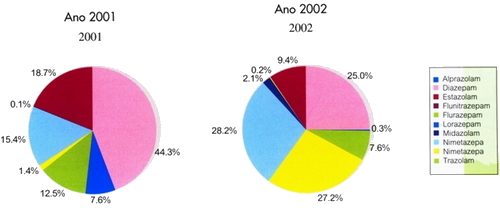
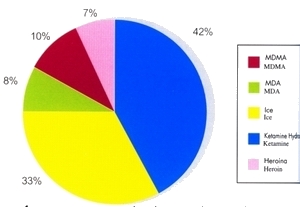
The year
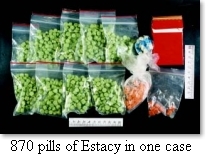
2002 witnessed a total number of 51 ecstasy-related cases with 3397.75
pills compared to 77 cases in the year 2001 which decreased by about
34%. Statistics divided from years 2001-2002 suggest that ecstasy-related
cases took ice and ketamine as the main components, wilh MDMA and MDA
declining (see Diagram 3).
Diagram
3 :Percentage of ecstasy component submitted for analysis (2001-2002)
Diagram
4: Percentage of Benzodiazepines and psychotropic substances
Diagram5: Statistics of exhibits
submitted for quantitative analysis Findings
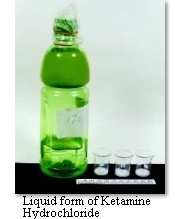
from quantitative analysis show that the content of MDMA in ecstasy
range from 26% - 50%; MDA 31% - 38%; Ketamine 1% - 66% and Ice 1% -
31%. The content of Ketamine in powder range from 0.3% - 97%, an extreme
difference; in addition, the content of Ice in "K powder"
ranges from 4% - 10%, and that in crystal submitted for analysis is
an average of 84%.
(2) Future Development and Planning
Note:
Statistics and data of this article is derived
from cases submitted for analysis by Drug Criminal Cases Investigation
Division under Judiciary Police, Public Security Police, Macao Customs
Service, Public Prosecutions Office and |
||||||||||||||||||||||||||||||
 Over
the past year, apart from completing qualitative analyses on drugs,
the Forensic Laboratory also developed quantitative analysis. As required
by the local criminal law, it is expected that there will be more and
more cases requesting quantitative analysis. The Forensic Laboratory
will raise the level of equipments, technology and staff to provide
law-enforcing agencies with highly effective service on evidence. At
the same time, the laboratory will continue to maintain close ties with
other international and neighboring forensic laboratories plus other
related anti-drug agencies, such as the Forensic Science Division of
the Government Laboratory of Hong Kong SAR, the Singapore Forensic Laboratory,
various related examination centers in China, the Drug Enforcement Administration
of America as well as the United Nations Drug-Control Organization etc.,
and to strengthen staff training and participating in international
and neighboring regions' drug-related conferences and seminars in the
hope that chemists and technicians can acquire the latest drug-related
information and technical knowledge so as to make progress and innovation
in laboratory work.
Over
the past year, apart from completing qualitative analyses on drugs,
the Forensic Laboratory also developed quantitative analysis. As required
by the local criminal law, it is expected that there will be more and
more cases requesting quantitative analysis. The Forensic Laboratory
will raise the level of equipments, technology and staff to provide
law-enforcing agencies with highly effective service on evidence. At
the same time, the laboratory will continue to maintain close ties with
other international and neighboring forensic laboratories plus other
related anti-drug agencies, such as the Forensic Science Division of
the Government Laboratory of Hong Kong SAR, the Singapore Forensic Laboratory,
various related examination centers in China, the Drug Enforcement Administration
of America as well as the United Nations Drug-Control Organization etc.,
and to strengthen staff training and participating in international
and neighboring regions' drug-related conferences and seminars in the
hope that chemists and technicians can acquire the latest drug-related
information and technical knowledge so as to make progress and innovation
in laboratory work.